

Most A/B tests don't fail because the idea was bad.
They fail because the test was read badly.
Someone stopped it on day 3 because the dashboard turned green. Someone shipped a "winner" that quietly lost money. Someone ran it on 4,000 users and called a 1% lift "significant". Someone saw conversion go up and AOV go down, and the meeting turned into a debate about opinions.
Here's a number that should change how you think about experiments. Ronny Kohavi, who built experimentation at Microsoft, Amazon and Airbnb, published success rates across companies. At Microsoft, about 1 in 3 ideas improved the metric they were meant to improve. At Bing, it was about 15%. At Booking, Google Ads and Netflix, about 10%. At Airbnb Search, about 8%.
So most of your ideas won't work. That's normal. The real risk is a test that tells you a losing idea won.
That's what this guide fixes. Not "what is A/B testing". You can get that anywhere. This is the full operating manual: how to write the hypothesis, calculate sample size and power, run the test without fooling yourself, decide what to do when your metrics point in opposite directions, and how all of it changes for AI products.
We'll do it with one experiment, from idea to decision, with every number shown.
The whole playbook in 9 lines
An A/B test is a decision tool, not a stats exercise. Start with the decision you want to make.
Write the hypothesis in one sentence: because, change, metric, by how much, for whom, without hurting what.
Pick one primary metric and 2 to 4 guardrails before launch. Not after.
Sample size comes from four inputs: baseline, minimum detectable effect, significance level and power. Calculate it first.
Run full weeks. Don't stop because the dashboard turned green on day 3.
Check sample ratio mismatch before you read a single result.
When metrics disagree, use TRADE: Trust, Read the tree, Anchor to the OEC, Dig into segments, Express it in rupees.
For AI features: offline evals first, A/B test second, holdout third. Cost and latency are metrics, not footnotes.
Write every test up, wins and losses. The log is the real asset.
Bookmark this. It's long because it's complete. Let's go.
Part 1: What A/B testing actually is (for a PM)
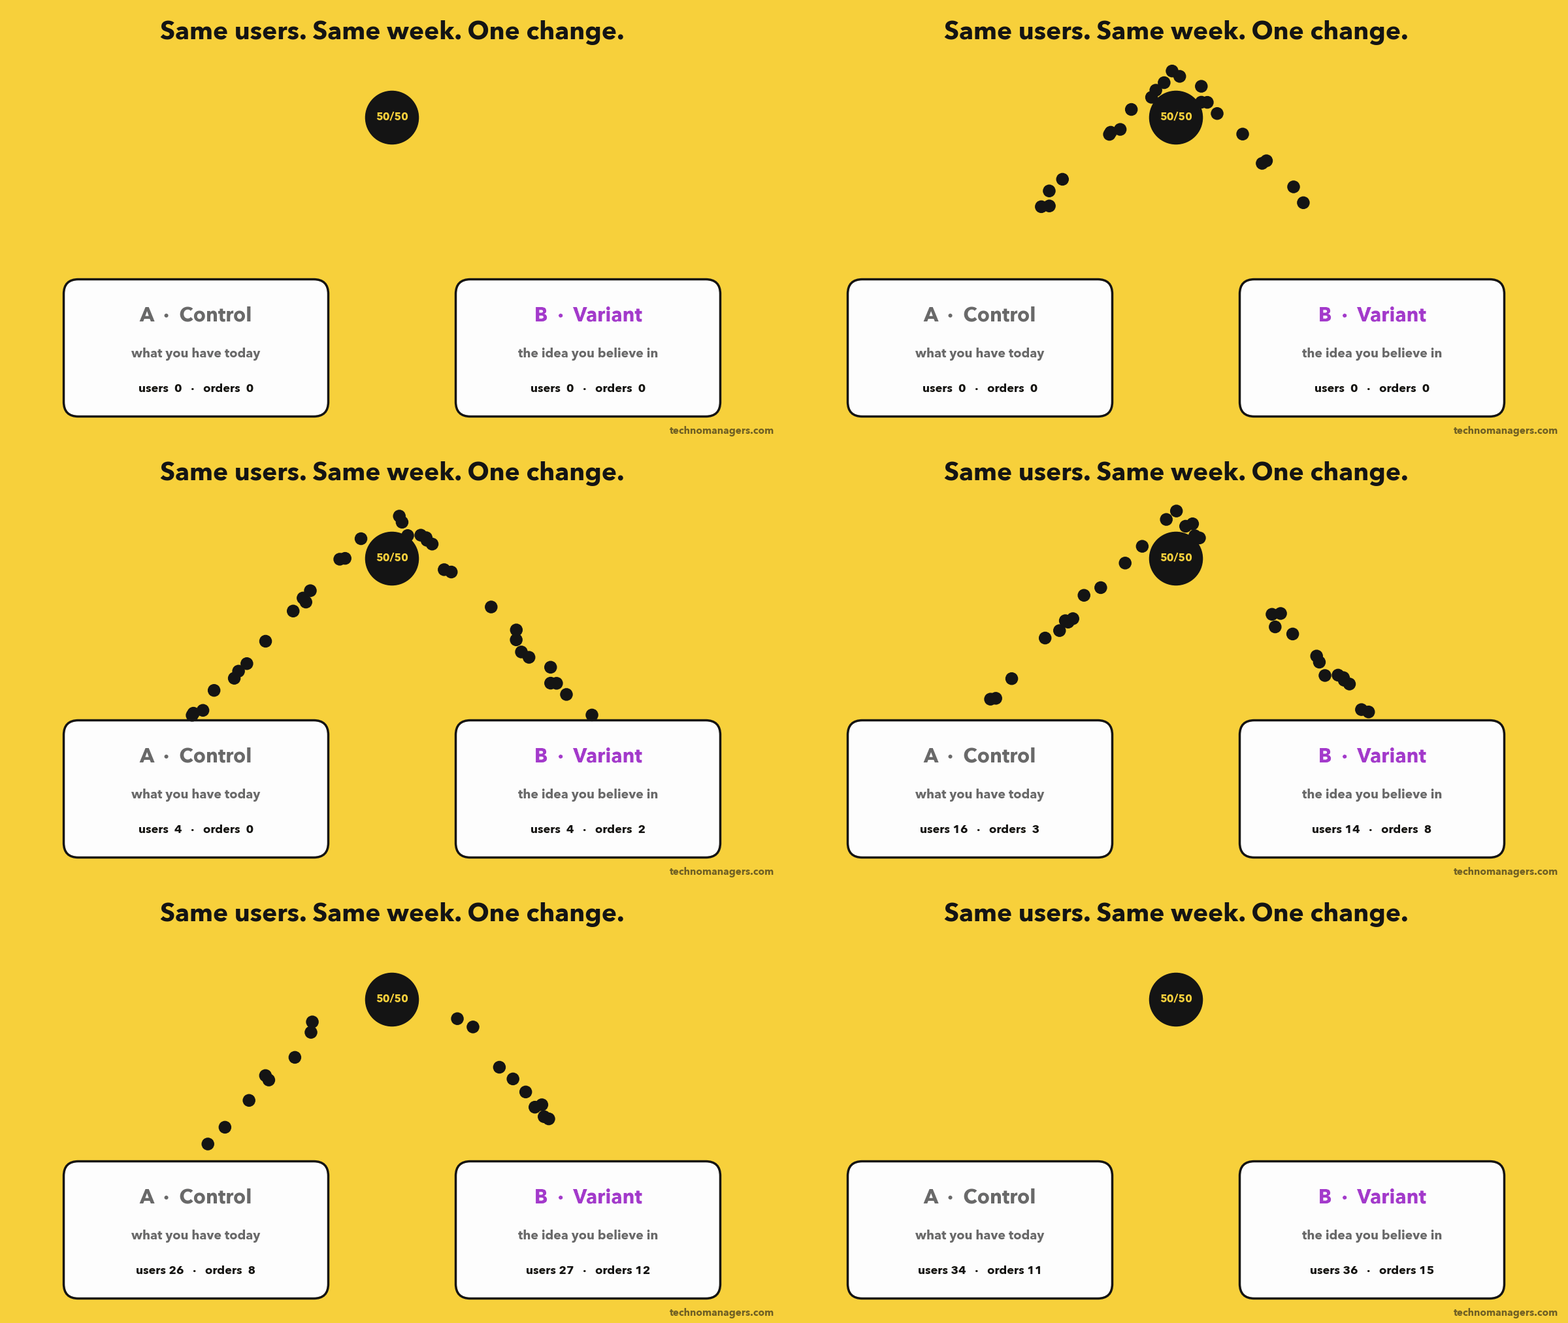
An A/B test (also called an online controlled experiment) splits real users at random into two groups. Group A, the control, sees the product as it is today. Group B, the variant, sees one change. You compare a metric between the two.
Because the split is random, the only systematic difference between the groups is your change. Same week, same festivals, same marketing campaigns, same app bugs. So if the metric moves more than random noise would explain, your change caused it.
That last word is the point. Dashboards show correlation. A/B tests show causation. It's the only tool a PM has that answers "did my feature cause this?"
Why this is a PM skill, not a data science skill
Your data scientist will run the stats. But the decisions that make or break the test are yours:
What are we trying to learn? (the hypothesis)
What does success mean? (the primary metric)
What are we not willing to break? (the guardrails)
How small a win is worth detecting? (the MDE, a business call, not a statistical one)
What do we do when the results are mixed? (the decision)
Get those wrong and perfect statistics won't save you.
Why companies obsess over it
Two famous examples show why.
Bing's $100M headline. A Microsoft employee suggested a small change to how ad headlines were displayed on Bing. It sat in the backlog for more than six months because nobody thought it mattered. An engineer finally tested it in a few days. Revenue went up 12%, worth over $100 million a year in the US alone. It was so big it triggered an internal "too good to be true" alert, and was replicated before anyone believed it. (HBR, Kohavi & Thomke)
Obama's sign-up button. In 2008, the Obama campaign tested 4 buttons and 6 images on its sign-up page. The winning combination ("Learn More" plus a family photo) raised sign-ups by 40.6%. The campaign estimated the extra emails were worth about $60 million in donations. (Optimizely)
The lesson isn't "small changes make millions". It's that nobody's intuition, including the HiPPO's (the Highest Paid Person's Opinion), predicted either result.
When NOT to run an A/B test
Senior PMs know when to skip it. Don't A/B test when:
You don't have the traffic. If the sample size calculation says 4 months, the test won't give you an answer. Use qualitative research, a fake-door test, or test a bigger change.
It's a one-way door. Pricing changes that go viral on Twitter, brand redesigns, legal or compliance changes. You can't "un-show" them.
The change is obviously right. Fixing a crash, meeting a regulation, fixing a broken checkout. Just ship it.
Users affect each other. Marketplaces, social networks and ride-hailing have network effects. If variant drivers take orders away from control drivers, a normal A/B test gives you a biased answer. LinkedIn built special cluster-based designs for exactly this. Use switchback or geo tests instead.
It's a strategic bet. "Should we enter quick commerce?" is not an A/B test. It's a strategy decision.
Part 2: The example we'll use for the rest of this guide
Imagine you're a PM at a food-delivery app the size of Swiggy or Zomato. Let's call it Tiffin.
Note: Tiffin is a made-up company so I can show you every number. The traffic and order values are in a realistic range for a large Indian consumer app, and every calculation below is real math you can redo on your own data.
The observation. Your data team finds that about 40% of orders are repeats: the exact same restaurant and dish the user ordered before. You watch session recordings and run 12 user interviews. Repeat users open the app, scroll, search, open the restaurant, find the dish, add it, check out. That's 5 or more taps to order something they've ordered 20 times.
The idea. A one-tap card at the top of the home screen: "Reorder your usual". Your last order, one tap to cart.
Everyone in the room loves it. Which is exactly why you test it.
Part 3: The A/B test, step by step
Step 1: Write the hypothesis
A weak hypothesis: "The reorder card will improve the user experience."
You can't test that. What's "improve"? By how much? For whom?
A strong hypothesis has six parts:
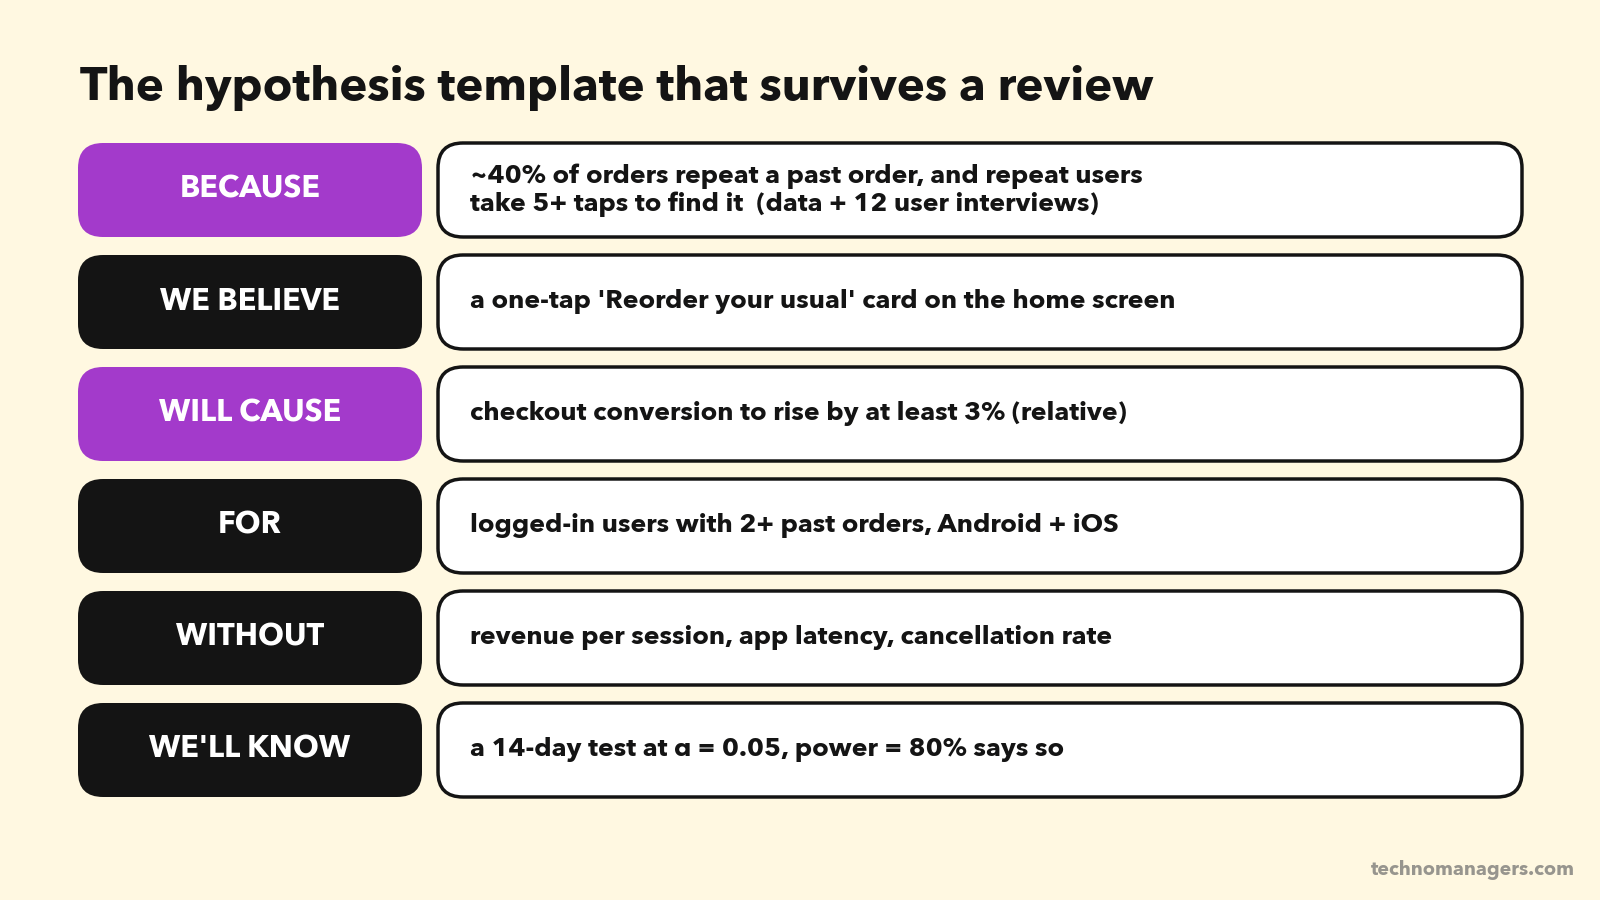
Written as one sentence:
Because ~40% of orders are repeats and repeat users need 5+ taps to find their usual, we believe a one-tap "Reorder your usual" card will increase checkout conversion by at least 3% (relative) for logged-in users with 2+ past orders, without hurting revenue per session, app latency or cancellation rate.
In statistics language, this becomes two statements:
Null hypothesis (H₀): the card makes no difference to conversion.
Alternative hypothesis (H₁): the card changes conversion.
The test never "proves" H₁. It tells you whether the data is surprising enough that you should stop believing H₀.
Step 2: Choose your metrics (this is where most tests are lost)
You need three kinds of metrics, and you need to write them down before the test starts.
1. Primary metric (one!). The single metric that decides the test. Ours: checkout conversion rate, meaning sessions that end in a placed order divided by eligible sessions.
Why only one? Because if you watch 20 metrics, one will move by pure chance. At a 5% significance level, the chance that at least one of 20 unrelated metrics shows a "significant" result is 64%. That's how teams fool themselves.
2. Guardrail metrics (2 to 4). Things you're not allowed to break, even if the primary metric wins. Ours:
Revenue per session (the money)
App start latency (the card adds an API call)
Order cancellation rate (did people reorder by accident?)
New-restaurant discovery: the share of orders from a restaurant the user has never ordered from (the restaurant ecosystem)
3. Diagnostic metrics. These help you explain why the result happened: card tap rate, time to checkout, add-on attach rate.
The OEC: the metric behind the metric
Mature experimentation teams define an OEC (Overall Evaluation Criterion): one metric, or a weighted combination, that predicts long-term value, not just this week's numbers.
Here's why it matters. Bing once shipped a bug that showed users terrible search results. Queries per user went up 10%, and revenue per user went up 30%. Users had to search more, and the ads looked relevant by comparison. A short-term metric would have called the bug a big win. (Kohavi et al.)
That's why Bing's OEC uses sessions per user: people coming back because they're happy, not searching harder because they're stuck.
For Tiffin, a sensible OEC is something like order-days per user over 28 days (are people ordering more often?), with revenue as a guardrail.
PM rule: if a metric can go up because users are frustrated, it can't be your primary metric on its own.
Step 3: Choose the randomisation unit and who gets counted
Randomise by user, not by session or pageview. If you randomise by session, the same person sees the card on Monday and not on Tuesday. That's confusing for them and contaminates your data.
Count only the users who could be affected. The card only appears for logged-in users with 2+ past orders. New users never see it. If you include them, you dilute the effect with people who can't respond to the change, and you need far more traffic. This is called triggering. Count a user from the moment they would have seen the card (in control, too).
Step 4: Calculate the sample size
This is the part most PMs skip and most interviewers ask about.
You need four inputs.
1. Baseline rate. Today's conversion for eligible sessions: 12%. Take it from the last 4 weeks of data.
2. Minimum Detectable Effect (MDE). The smallest lift you care about detecting. We said 3% relative, which means 12% → 12.36%.
This is a business decision. Ask: "What's the smallest lift that would justify shipping and maintaining this?" If a 1% lift wouldn't change your decision, don't size the test to detect it.
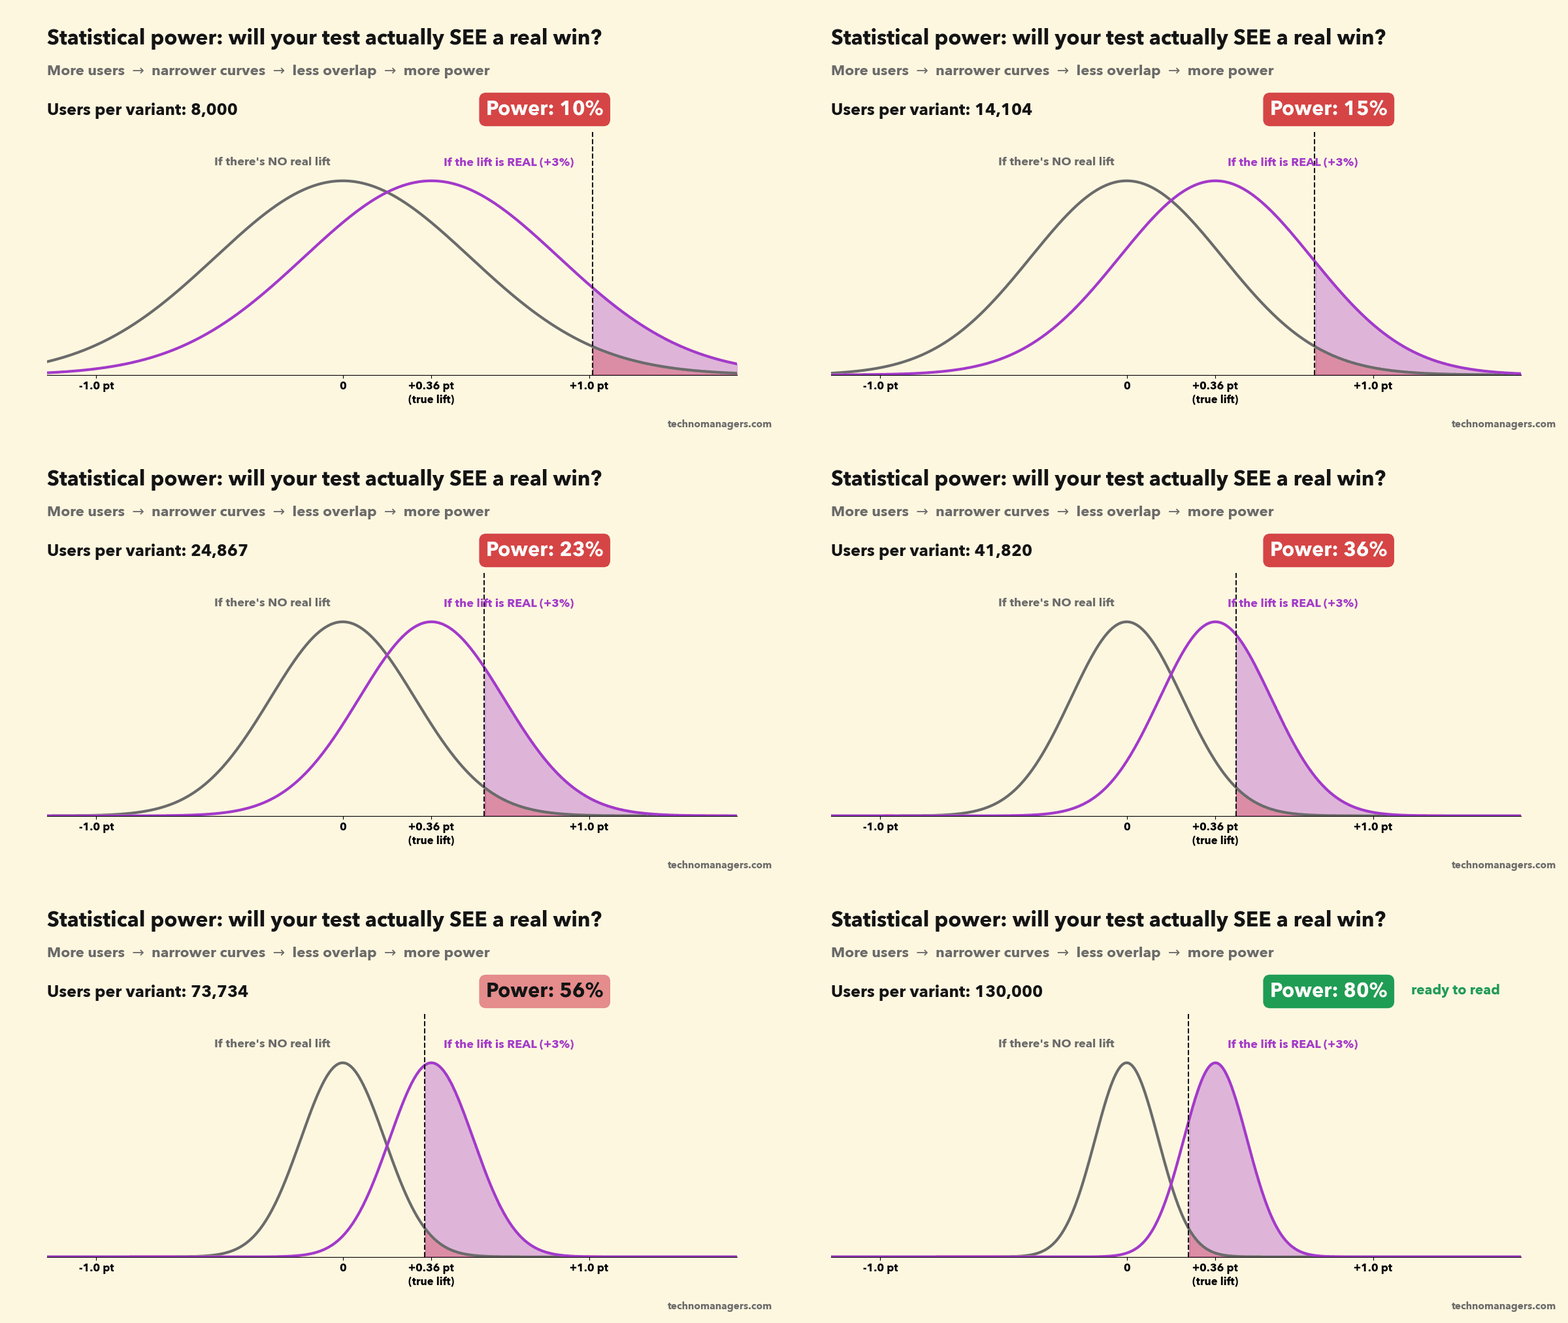
3. Significance level (α) = 0.05. The false-alarm rate you accept. If the card truly does nothing, there's a 5% chance the test still says it works. This is a Type I error, or false positive.
4. Power (1 − β) = 80%. If the card truly lifts conversion by 3%, there's an 80% chance the test detects it. The other 20% is a Type II error, or false negative: a real win you miss.
Think of a smoke alarm. α is how often it goes off when there's no fire. Power is how often it goes off when there is a fire. You want a low α and high power. Both cost you sample size.
The formula (you only need to understand it once)
For a conversion metric, the sample size per variant is:
n = (z₁₋α/₂ + z₁₋β)² × [p₁(1 − p₁) + p₂(1 − p₂)] ÷ (p₂ − p₁)²
Plugging in our numbers:
z for α = 0.05 (two-sided) = 1.96
z for 80% power = 0.84
p₁ = 0.12, p₂ = 0.1236
(1.96 + 0.84)² = 7.85
p₁(1 − p₁) + p₂(1 − p₂) = 0.1056 + 0.1083 = 0.2139
(p₂ − p₁)² = 0.0036² = 0.00001296
n = 7.85 × 0.2139 ÷ 0.00001296 ≈ 129,557 sessions per variant.
So about 2.6 lakh eligible sessions in total.
From sample size to duration
Tiffin has about 1.85 lakh eligible sessions a day. You put 10% of them in the test (always start small), which gives about 18,500 sessions a day.
259,114 ÷ 18,500 ≈ 14 days. That's two full weekly cycles, which is what you want anyway. Food ordering on a Sunday night looks nothing like a Tuesday lunch.
Now look at how fast the MDE changes the answer:
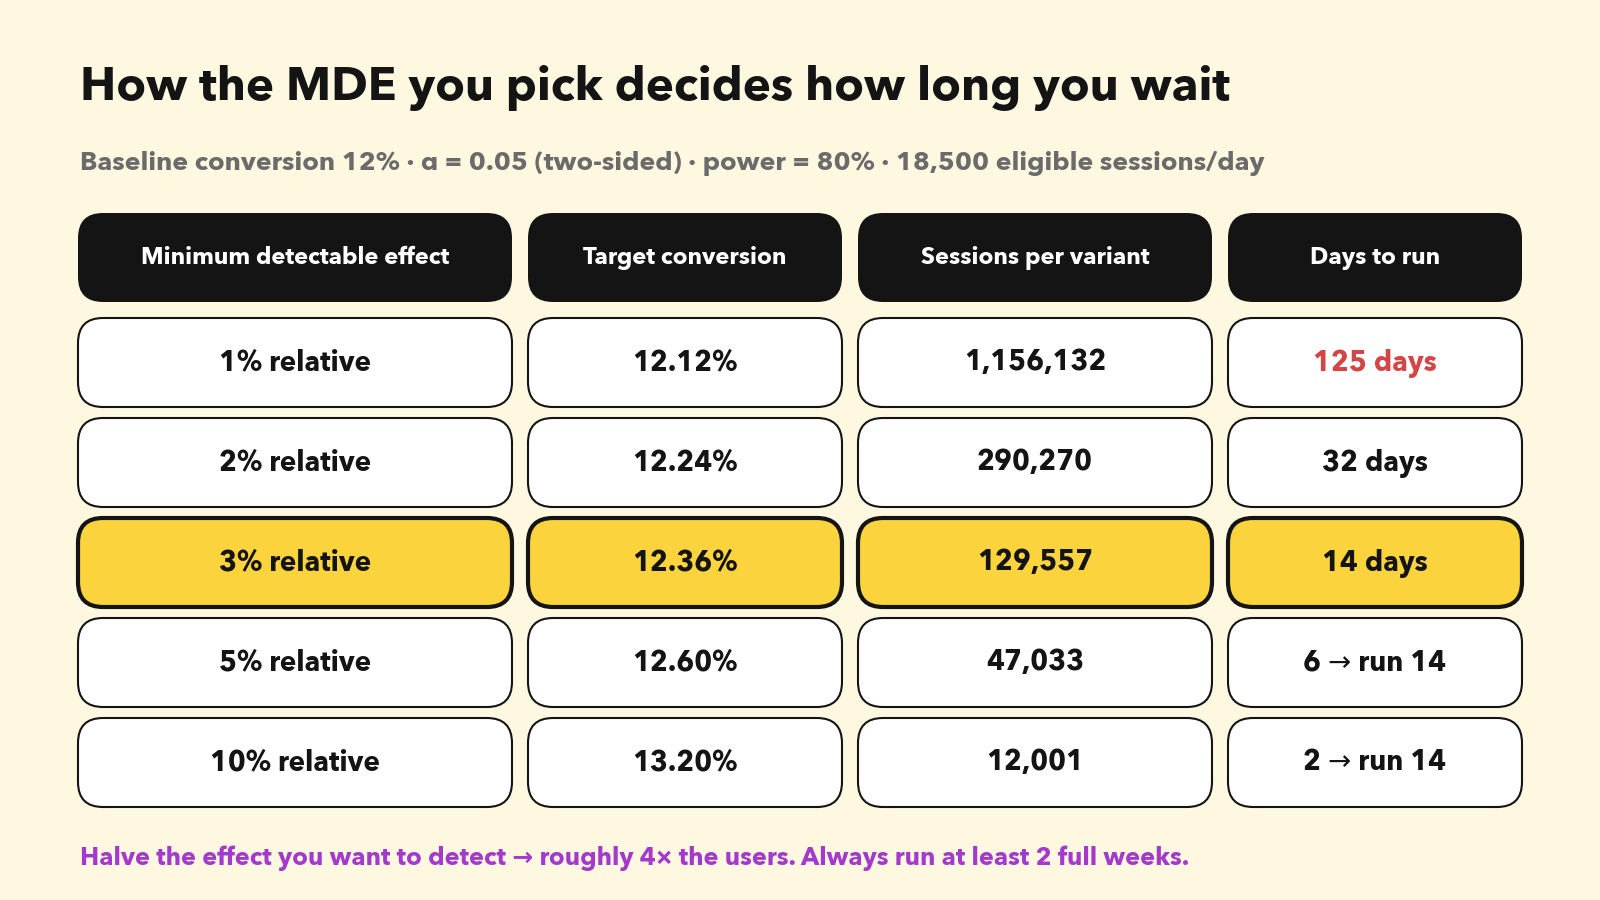
Want to detect a 1% lift? That's 125 days. Nobody will wait that long, so you'd either test a bolder change or accept that you can't measure small wins on this surface.
Rule of thumb: always run for at least 1 to 2 full weeks, even if the calculator says 3 days. And decide the duration before launch.
What if you don't have Swiggy-level traffic?
This is the reality for most Indian startups and B2B products. Kohavi's numbers make the point: at a 5% relative MDE and 80% power, a 50% baseline needs about 12,000 users, a 10% baseline needs about 100,000, and a 1% baseline needs about 1.3 million. (GrowthBook summary of Kohavi)
Your options:
Test bigger changes. A 10% MDE needs about 10× fewer users than a 3% MDE.
Move the metric upstream. "Clicked reorder" happens far more often than "placed order", so you need fewer users to detect a change in it. Just be careful it still predicts the outcome you care about.
Use variance reduction (CUPED). It uses each user's behaviour before the experiment to remove noise. At Bing it cut variance by about 50%, which means the same power with half the users. Ask your data team if your platform supports it. Statsig, Eppo, GrowthBook and Optimizely all do.
Use fewer variants. Every extra arm needs its own full sample.
Don't A/B test. Use fake-door tests, usability tests or a staged rollout with careful before/after monitoring.
Step 5: Pre-flight checks before you launch
Run an A/A test if your setup is new. Split users into two groups that both see the same experience. You should see no significant difference about 95% of the time. If your A/A tests keep "finding" winners, your pipeline is broken. Fix it before you trust anything.
Pre-register the plan. A one-page doc: hypothesis, primary metric, guardrails, MDE, sample size, duration, and the decision rule ("ship if conversion is significantly up and no guardrail is significantly down"). Share it before launch. This one habit prevents most "let's slice the data until something looks good" meetings.
Ramp gradually. 1% for a day to catch crashes, then up to the full allocation.
Step 6: Run it, and don't peek
This is the most common mistake in the industry, so it gets its own animation.
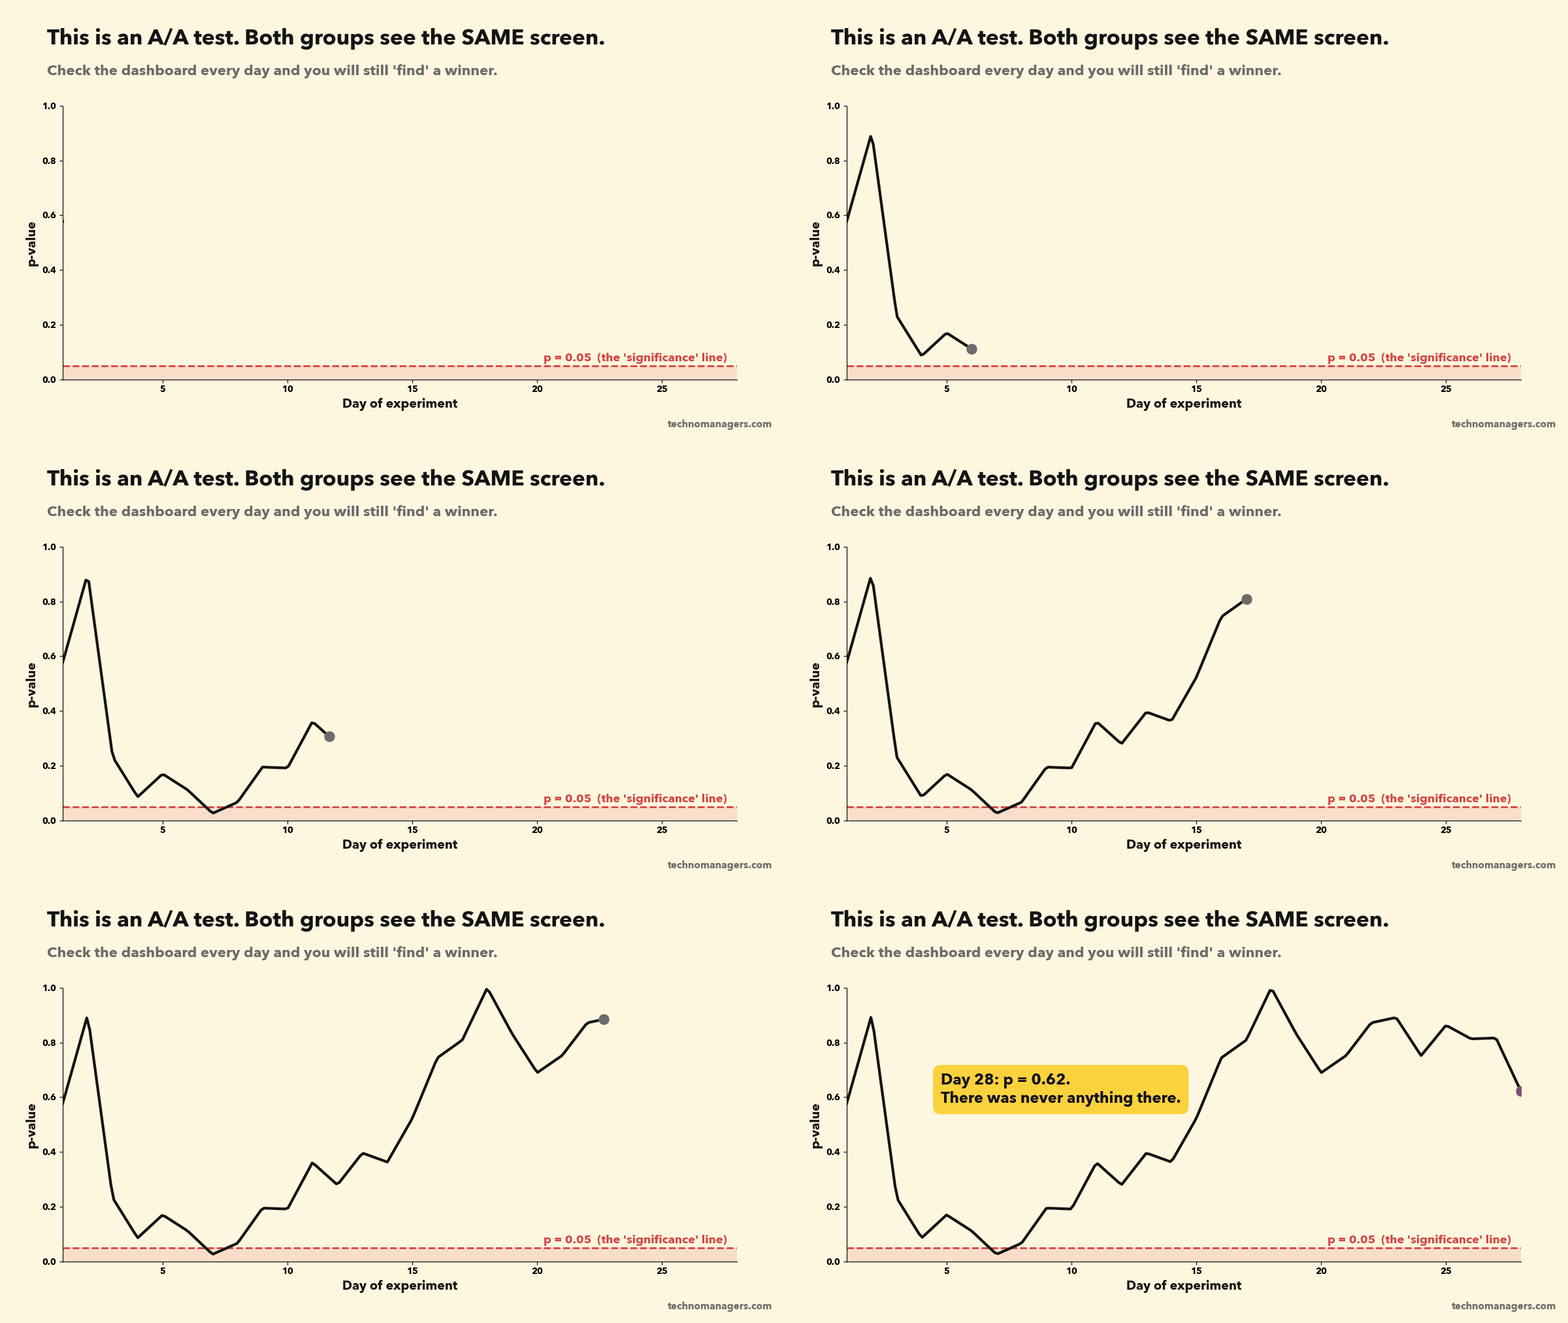
Every time you look at the results and are ready to stop if p < 0.05, you get another chance to be fooled by noise. Evan Miller showed that checking after every new data point pushes your real false-positive rate from 5% to 26.1%. (Evan Miller) Even checking once a day across a test can push it to around 17%.
The p-value isn't a progress bar. It moves around a lot, especially early.
What to do instead:
Fix the duration in advance and read the result once, at the end.
Look early only for disasters: crashes, a broken checkout, a guardrail falling off a cliff. Stopping for harm is fine. Stopping for a win isn't.
If you really need to stop early for wins, use a method designed for it: sequential testing. Spotify, for example, uses group sequential tests that spend the 5% error budget across several planned looks. (Spotify Engineering) Most modern platforms offer it as a setting.
Watch for novelty and primacy effects. A shiny new card gets tapped because it's new (novelty). A changed layout can annoy users at first and grow on them later (primacy). Compare week 1 with week 2. If the lift is shrinking, wait for it to settle before you decide.
Step 7: Read the results
Day 14. The test is done. Here are the numbers.
First: trust check (sample ratio mismatch)
Before you look at a single metric, check that the split is what you asked for.
Control: 131,204 sessions
Variant: 130,588 sessions
You asked for 50/50. A chi-square test gives χ² = 1.45, p = 0.23. That's fine. The difference is within normal randomness.
If p were below 0.001, you'd have a Sample Ratio Mismatch (SRM). Something is dropping users from one group: a crash, a redirect, a bot filter, a logging bug. An experiment with SRM can't be trusted, however good the results look. This isn't rare. Microsoft found about 6% of its experiments had SRM. (Microsoft Research)
Then: the primary metric
Control: 15,744 orders from 131,204 sessions = 12.00% conversion
Variant: 16,294 orders from 130,588 sessions = 12.48% conversion
Relative lift: +3.98%
p-value: 0.0002
95% confidence interval: +1.9% to +6.1%
How to say this in plain English in your review meeting:
p-value = 0.0002: "If the card did nothing at all, we'd see a gap this big about 2 times in 10,000. So it almost certainly did something."
Confidence interval +1.9% to +6.1%: "The true lift is very likely somewhere between 1.9% and 6.1%. Even the worst case is a real improvement."
What a p-value is NOT: it is not "a 99.98% chance the variant is better". It's the probability of data this extreme if the null hypothesis were true. Say it wrong in an interview and a good interviewer will notice.
The primary metric won, clearly. Time to ship?
Not yet. Open the guardrails.
Part 4: When metrics move in opposite directions
Here's the full picture:
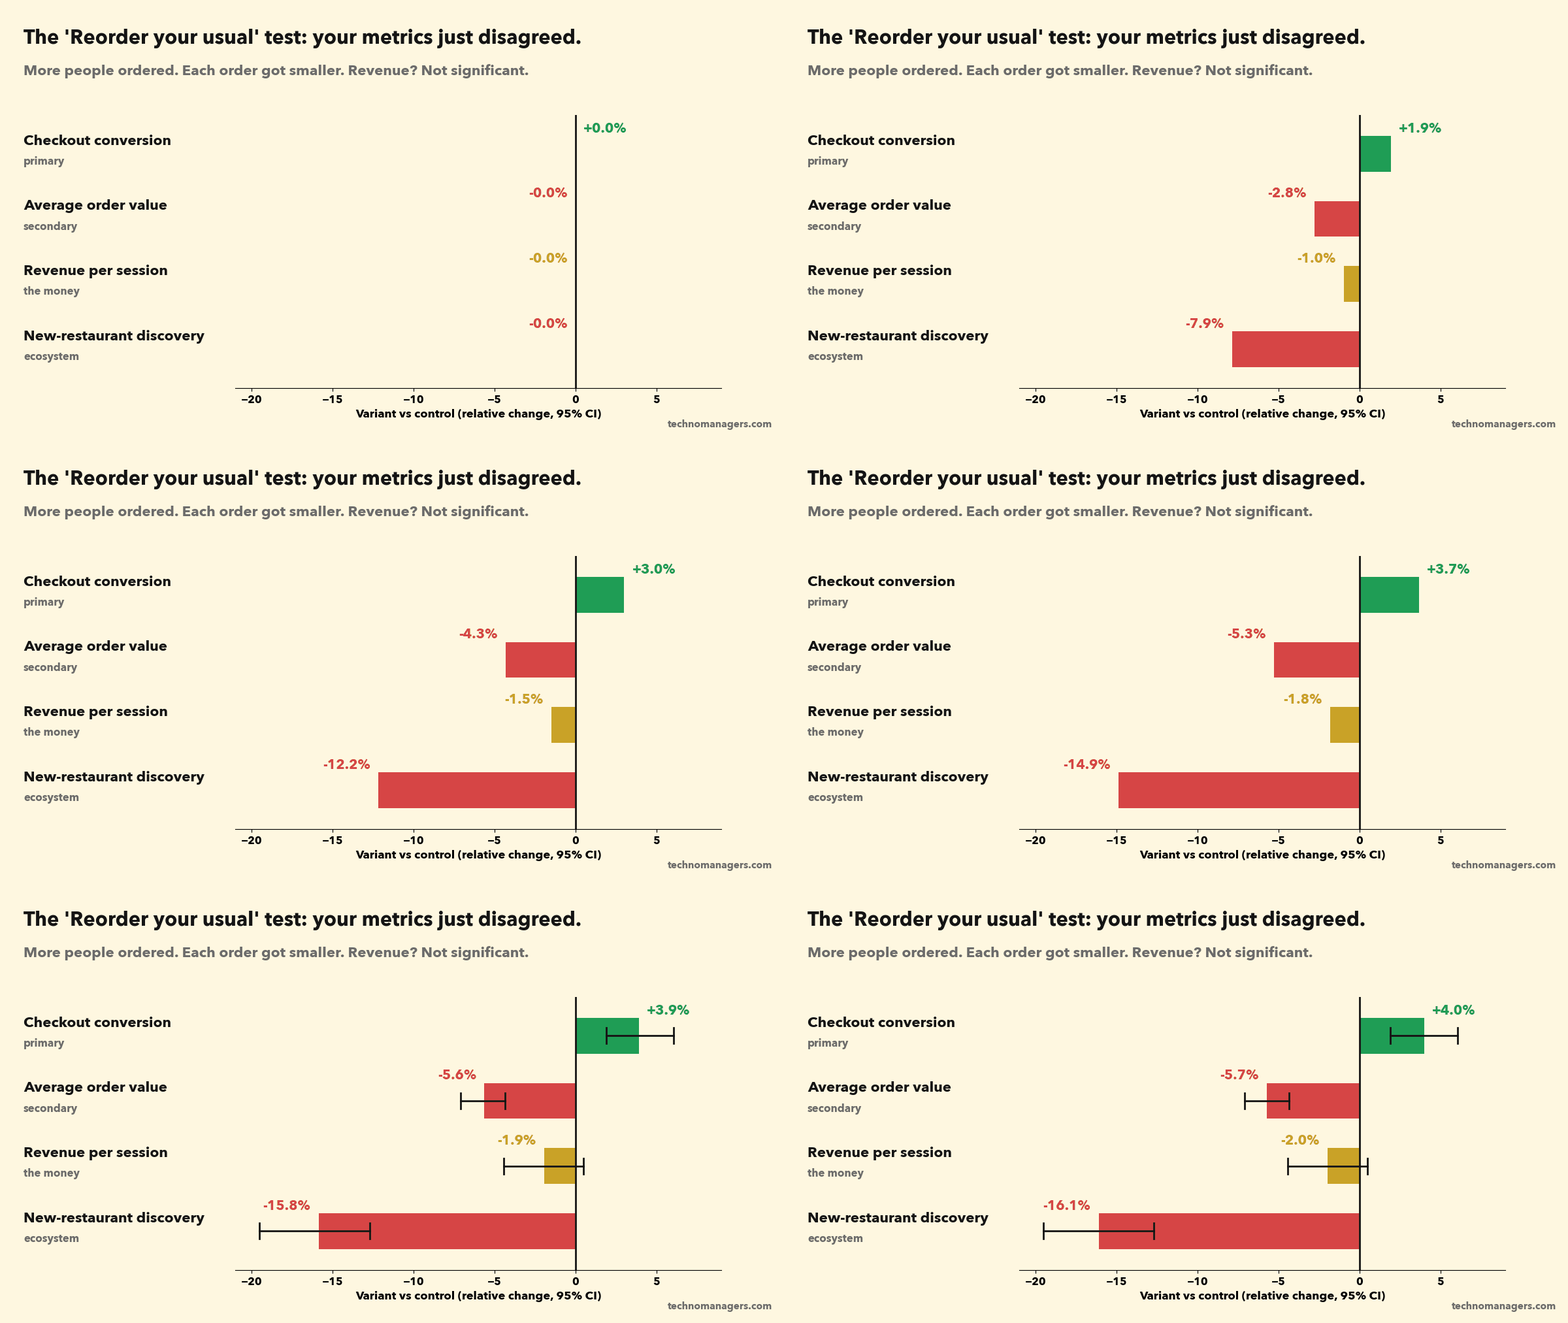
Checkout conversion: +4.0% (significant ✅)
Average order value: ₹420 → ₹396, −5.7% (significant 🔻)
Revenue per session: ₹50.40 → ₹49.41, −2.0% (p = 0.12, not significant, 95% CI −4.4% to +0.5%)
New-restaurant discovery: 31% → 26% of orders, −16% (significant 🔻)
Latency and cancellations: flat
Welcome to the most common situation in real product work. Your metrics just disagreed.
Most teams handle this badly. The growth PM says "conversion won, ship it". The finance partner says "revenue is down, kill it". The restaurant-partnerships team says nobody asked them. The meeting ends with "let's run it longer".
Here's a better way. I call it TRADE.
T: Trust the data first
Before you debate, make sure each movement is real:
Is it statistically significant? Revenue per session is not. The confidence interval runs from −4.4% to +0.5%. You can't say revenue went down. You also can't say it didn't. That's different from "no effect".
How many metrics did you check? If you looked at 30 metrics and one is significant, treat it as a hint, not a finding.
Apply Twyman's law: "Any figure that looks interesting or different is usually wrong." A huge surprise is more often a bug than a breakthrough. Check logging before you celebrate or panic.
R: Read the metric tree
Break the money metric into its parts:
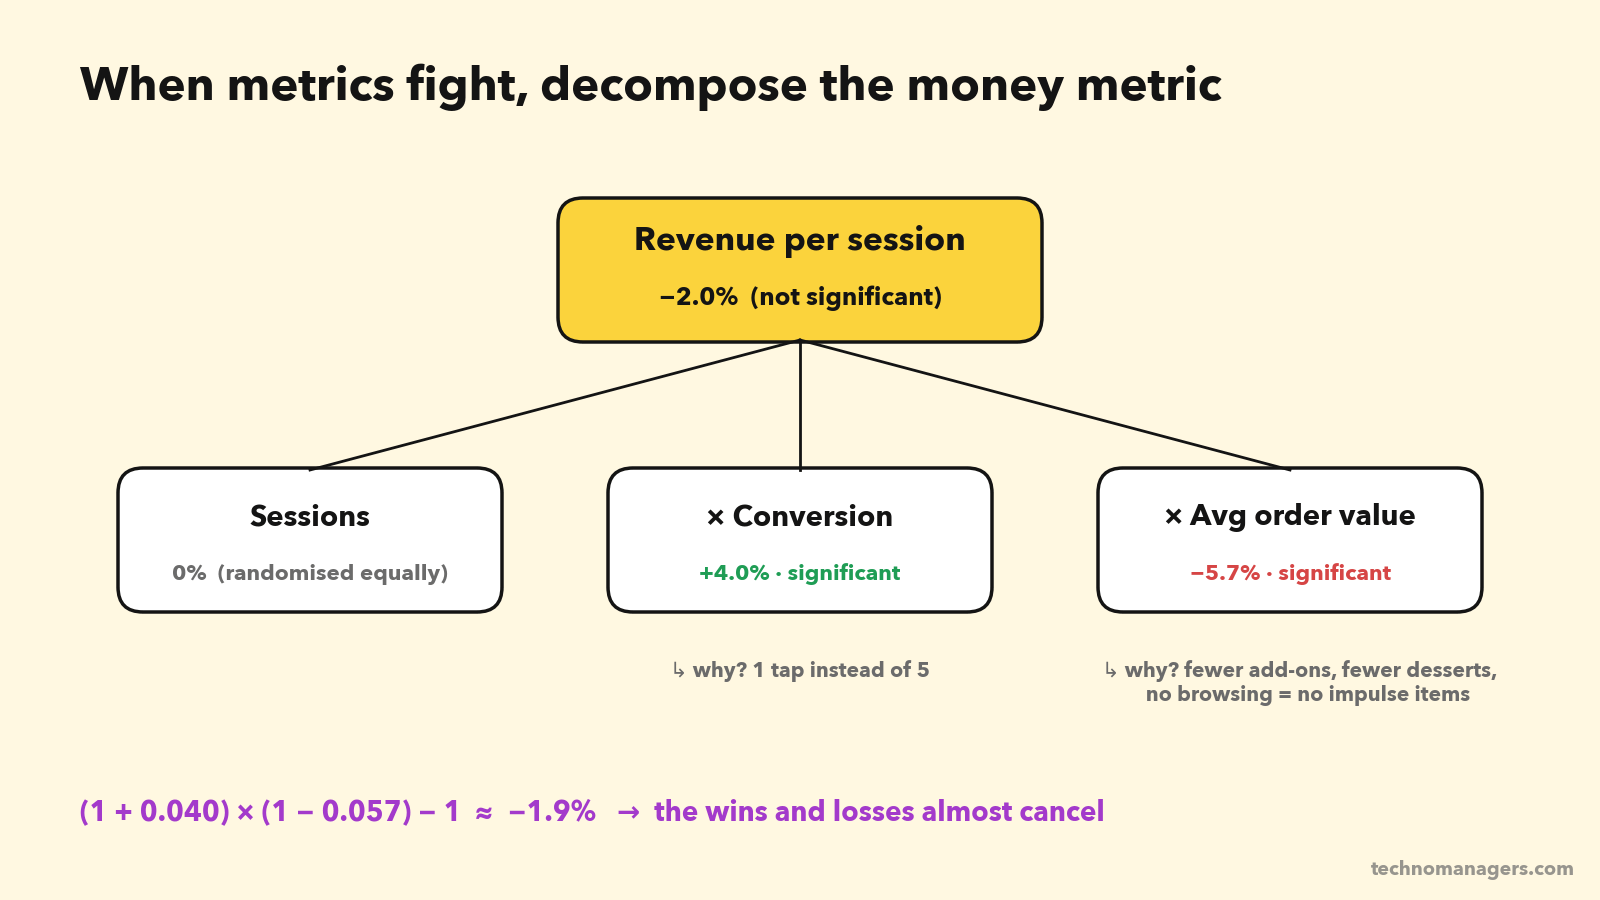
Revenue per session = Conversion × Average order value
(1 + 0.040) × (1 − 0.057) − 1 ≈ −1.9%
Now you can see the story. The card made ordering easier, so more people ordered. But it skipped the part of the journey where people browse, add a dessert, try a new place or add a drink. Fewer impulse add-ons, smaller baskets.
You've moved from "the metrics disagree" to "here's the mechanism". That's a much better meeting.
A: Anchor to the OEC and your pre-registered rule
What did you write down before launch? "Ship if conversion is significantly up and no guardrail is significantly down."
New-restaurant discovery is a guardrail, and it fell 16%, significantly. By your own rule, this doesn't ship as-is. This is why you pre-register: it stops the team from rewriting the rules after seeing the results.
Also ask: what does the OEC say? If the OEC is order-days per user over 28 days, more frequent ordering is good long-term. But less discovery means restaurants get fewer new customers, which hurts the supply side over months. Short-term and long-term pull in opposite directions.
D: Dig into segments (carefully)
Segments help you find who drives the effect, which points to better versions of the idea. Typical cuts: new vs heavy users, platform, city tier, time of day.
Say you find:
Heavy users (10+ orders a month): conversion +6%, AOV −2%. They mostly order the same thing anyway.
Light users (2 to 4 orders a month): conversion +2%, AOV −9%, discovery way down. The card is stopping them from exploring.
Useful. But be careful: if you slice 40 ways, something will look significant by chance. Treat segment findings as new hypotheses to test, not as results to ship.
E: Express everything in one currency
Debates go on forever when every team defends a different metric. Convert them to rupees.
At full rollout (1.85 lakh eligible sessions a day):
Revenue per session −₹0.99 (point estimate) × 1.85 lakh × 365 ≈ −₹6.7 crore order value a year.
The confidence interval runs from about −₹15 crore to +₹1.7 crore. That's a wide range of possible outcomes, and most of it is negative.
Discovery −16%: ask your partnerships team what a new customer is worth to a restaurant, and how many fewer new customers this means.
Now it's a business decision, not an argument.
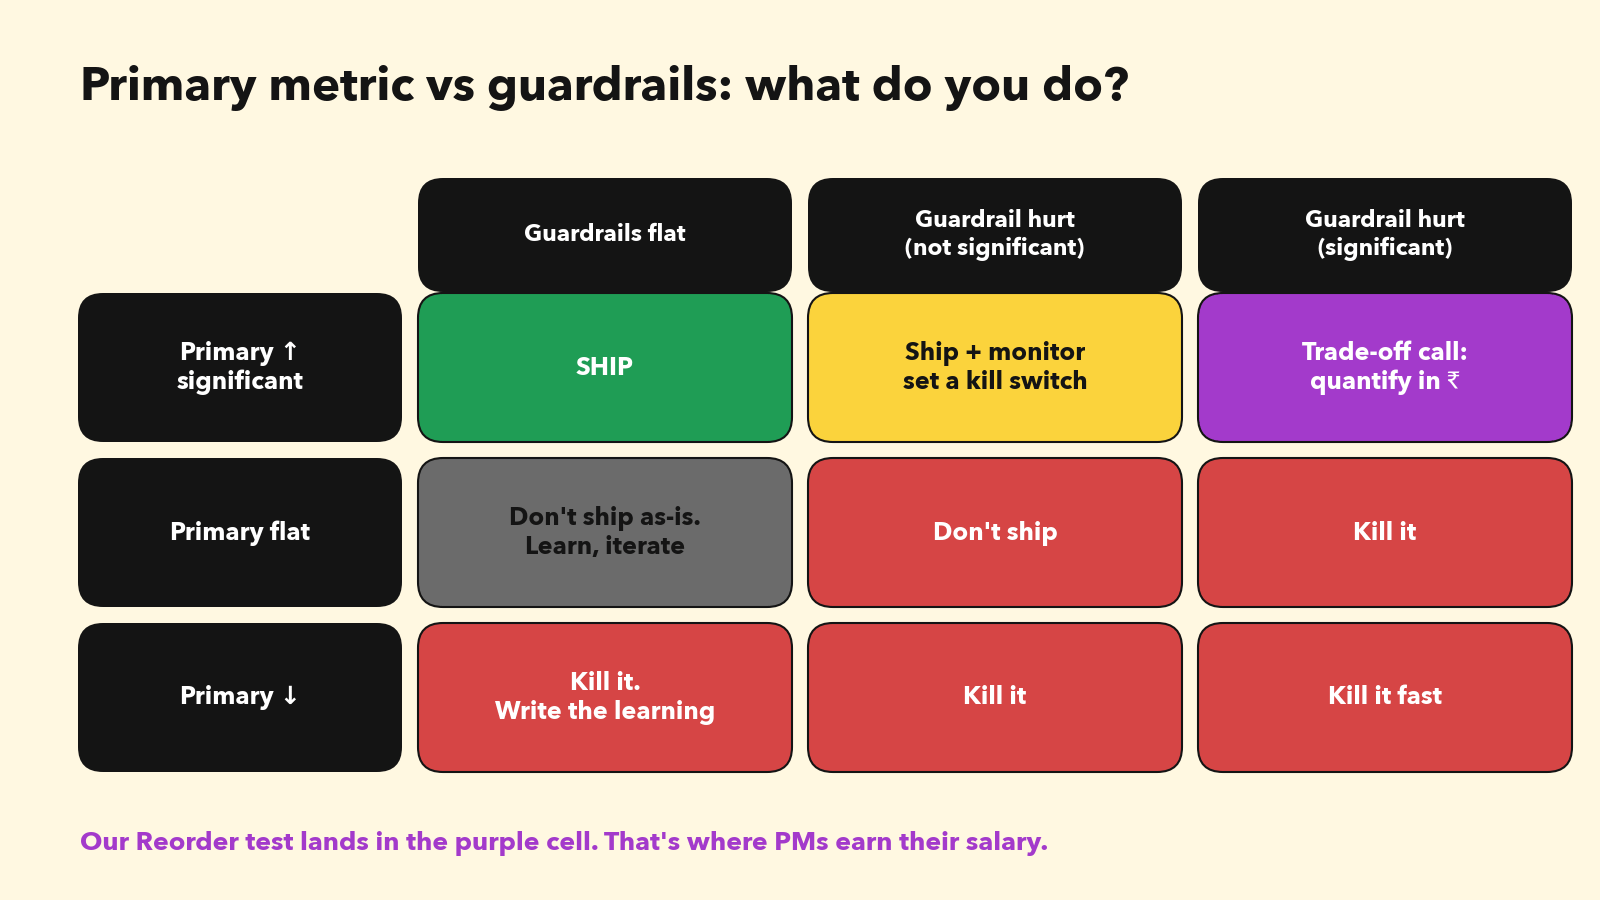
The decision
Don't ship v1. Ship the learning.
You now know three things you didn't know two weeks ago:
Friction in reordering is real. Removing it lifts conversion by about 4%.
The browse-and-discover part of the journey is worth real money in add-ons.
Heavy and light users respond very differently.
So you design v2: the reorder card plus a "Goes well with" add-on suggestion, plus a "New near you" strip right below it. You run a three-arm test: control vs v1 vs v2. Three arms of about 129,600 sessions each at 18,500 sessions a day is 21 days.
That's what a good experiment does. It doesn't just say yes or no. It tells you what to build next.
Real companies, same problem
This isn't hypothetical. It happens everywhere:
Duolingo tested a promotion for its paid Plus subscription. Revenue went up slightly, but user retention went down. They shut it down, because retention is their long-term engine. (Duolingo blog)
Google found that showing more ads raised short-term revenue but trained users to ignore ads over time. Its long-term experiments led it to cut mobile ad load by about 50%, and both user experience and business results improved. (Google Research)
OpenAI rolled back a GPT-4o update in April 2025. Offline evals "generally looked good", and A/B tests suggested users who tried it liked it. But a new thumbs-up reward signal had made the model overly agreeable, or sycophantic. A metric went up while quality went down. (OpenAI)
Which brings us to AI.
Part 5: A/B testing AI products (what changes)
Everything above still applies to AI features. But AI breaks some of the assumptions, so you need extra tools.
Why AI features are harder to test
1. Outputs aren't deterministic. The same question can get a different answer each time. That adds variance on top of user behaviour, so you need more samples. As Statsig puts it, "because LLM outputs can be stochastic, teams should ensure adequate sample sizes." (Statsig)
2. Quality isn't a single number. A button either increases clicks or it doesn't. An AI answer can be fast, confident, nicely formatted and wrong. You can't see that in conversion data.
3. Cost is a metric. A normal feature costs almost nothing per use. An LLM feature costs money on every call. A variant that wins on quality but doubles token spend is, as Arize puts it, "a decision, not a victory." (Arize)
4. Latency changes behaviour. A 4-second answer can lose users that a 1-second answer keeps. Microsoft found that slow AI responses lead users to abandon the feature.
5. Novelty is stronger. People try AI features because they're AI. The first-week spike can be big and misleading.
6. Feedback signals are biased. Thumbs up and down come from a small, self-selected group of users. Microsoft's experimentation team notes they "suffer from low sample size and selection bias". And as the OpenAI story shows, optimising for them can backfire.
The AI testing ladder: evals first, A/B test last
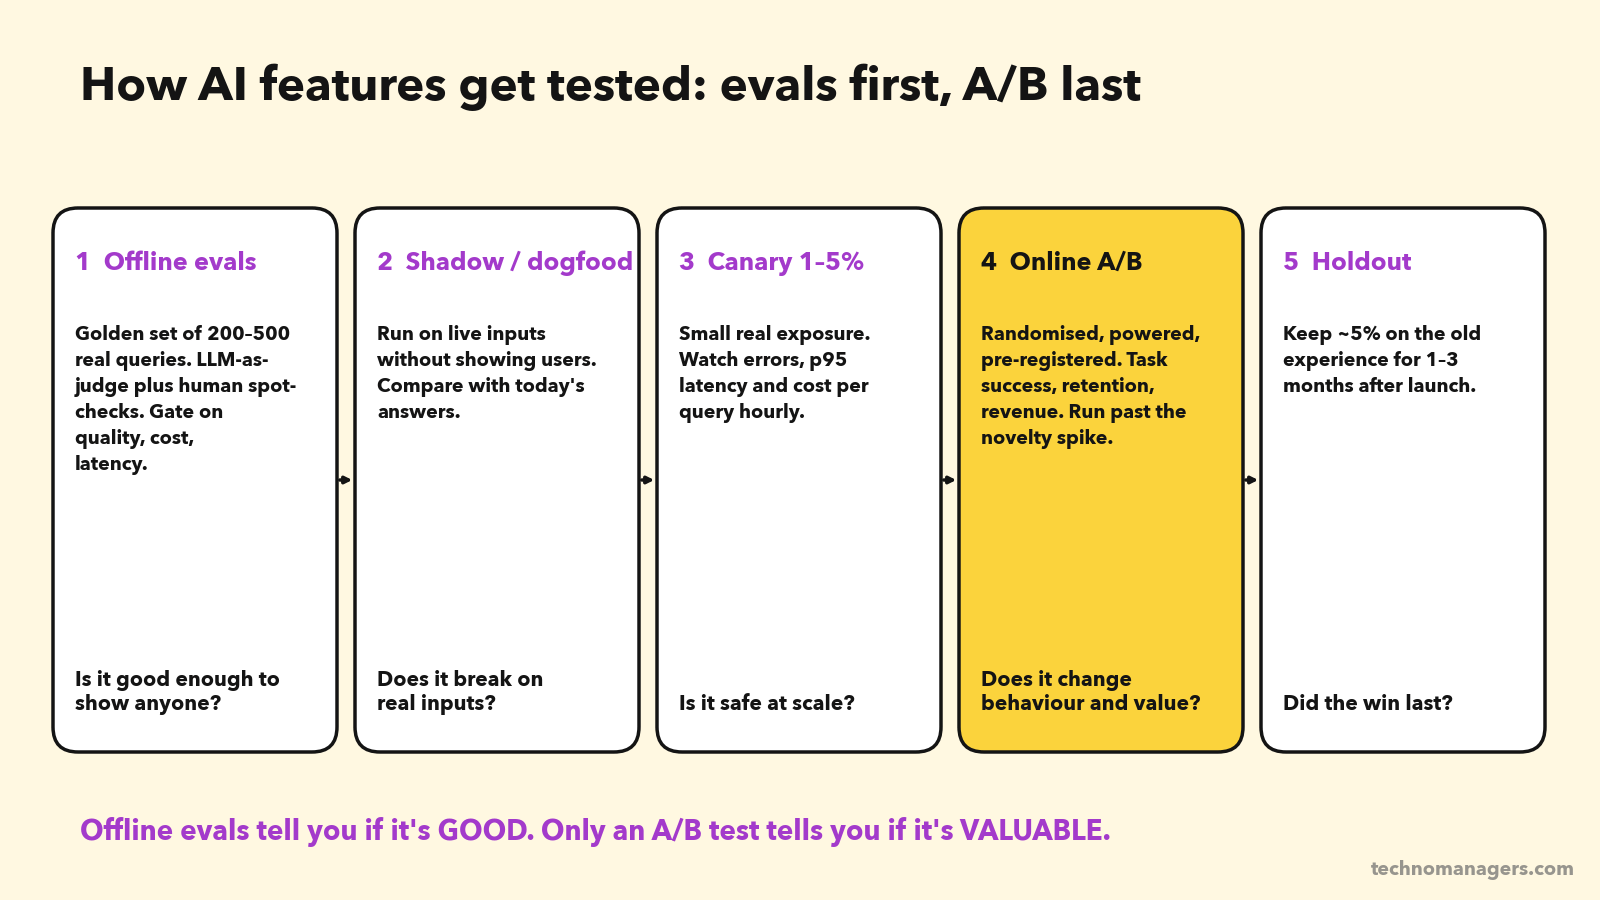
Rung 1: Offline evals. Before any user sees it, run the feature on a golden set of 200 to 500 real queries. Grade the outputs with code checks (did it follow the format, did it invent a dish?), an LLM-as-judge with a clear rubric, and human spot-checks. Strong LLM judges agree with human graders over 80% of the time, about as often as humans agree with each other (MT-Bench paper). But calibrate them against humans first.
Rung 2: Shadow mode / dogfood. Run the new model on live inputs without showing the output to users, or show it only to employees. You'll catch failures your golden set never imagined.
Rung 3: Canary. Expose 1 to 5% of users. Watch the guardrails hourly: error rate, p95 latency, cost per query, safety filter rate.
Rung 4: Online A/B test. Same rules as Part 3: hypothesis, primary metric, guardrails, sample size, fixed duration, SRM check.
Rung 5: Long-term holdout. After launch, keep about 5% of users on the old experience for 1 to 3 months. It's the only reliable way to know whether the AI win lasted after the novelty wore off.
The key mindset: offline evals answer "Is it good?" A/B tests answer "Does it change behaviour and create value?" You need both. Eval scores and real-world results don't always agree. GrowthBook reports a case where Intercom's version with a lower eval score did better in production.
The AI metric stack
Microsoft's experimentation platform team published a framework for measuring LLM features in experiments. (Microsoft ExP) Adapted for a PM, it has five layers:
Value (primary): task success, conversion, retention. Did the user get what they came for?
Engagement quality: acceptance rate (did they use the answer?), reformulation rate (did they have to ask again?), regenerate rate, copy or edit rate.
Quality and safety (guardrails): hallucination rate on sampled outputs graded by an LLM judge, safety filter triggers, complaint rate.
Latency (guardrail): time to first token and p95 end-to-end response time.
Cost (guardrail): cost per query, per session and per successful task.
Worked example: "Ask Tiffin" AI search
Back to Tiffin. You build an AI assistant on top of search: "Something spicy, veg, under ₹300, delivered in 25 minutes."
Offline gate (Rung 1). 300 real search queries from logs. Launch thresholds agreed with engineering:
At least 85% of answers meet all of the user's constraints (price, diet, time), graded by an LLM judge and checked by humans on 50 samples.
Zero hallucinated dishes. A code check confirms every dish exists on the restaurant's live menu.
p95 latency under 2.5 seconds.
Under ₹0.60 per query.
It passes with 88% constraint satisfaction, 0 hallucinations, p95 of 2.1s and ₹0.45 per query.
Online A/B test (Rung 4). Primary metric: conversion of search sessions. Three-week test, users randomised 50/50.
Search-session conversion: 30.0% → 30.78%, +2.6% (significant)
Query reformulation: −18% (users find it faster)
p95 latency: 0.4s → 2.1s (within the guardrail)
Week-by-week lift: week 1 +4.8%, week 2 +2.6%, week 3 +2.4%
See the last line? That's novelty. Week 1 was inflated. If you'd stopped after 7 days you'd have reported a lift almost twice as big as the real one. Use the stable weeks.
Now the economics. This is where most AI PMs stop too early.
Extra order value per search session: 0.78 percentage points × ₹410 AOV ≈ ₹3.20
Tiffin's take rate (commission) is about 20%, so extra contribution ≈ ₹0.64 per session
AI cost: about 1.6 queries per session × ₹0.45 ≈ ₹0.72 per session
Net: about −₹0.08 per session. The feature wins on every user metric and loses money on every session.
The decision isn't "kill it". It's "fix the cost, then ship": a smaller model for simple queries, caching for common ones, shorter prompts. At ₹0.25 per query, the cost drops to ₹0.40 per session and the feature makes about +₹0.24 per session. Then run the test again.
This is a real pattern, not just a made-up one. Duolingo reportedly cut the inference cost of its AI video call feature from about $0.30 to under $0.01 per session. (36Kr) In AI products, cost per successful task is a product metric.
Four more AI-specific rules
Change one thing at a time. Prompt, model, temperature and retrieval settings are all variables. Change two at once and you won't know which one moved the metric.
Every model upgrade is an experiment. A new model version can improve evals and still hurt your users. Run it through the ladder like any other change. Notion, for example, evaluates new frontier models against its own regression tests before rolling them out.
For ranking and recommendations, consider interleaving. Instead of showing group A one ranking and group B another, interleaving mixes both rankings into one list and sees which results users pick. Airbnb reported about 50× more sensitivity than a standard A/B test. (Airbnb Tech)
Don't optimise for thumbs-up alone. It's a biased, easy-to-game signal. Pair it with task success and graded quality. That's the OpenAI sycophancy lesson.
Fun fact that tells you where the industry is going: in September 2025, OpenAI acquired Statsig, an experimentation platform, and made its founder CTO of Applications. The biggest AI company in the world bought an A/B testing company. Experimentation is now an AI PM skill.
In the AI Product Builder Cohort, you build an eval framework with a golden test set and launch threshold (Week 5), and your capstone includes a full metrics stack with north star, supporting and guardrail metrics, plus an A/B test plan (Week 8). It's 12 weeks, live, and ends with a Demo Day.
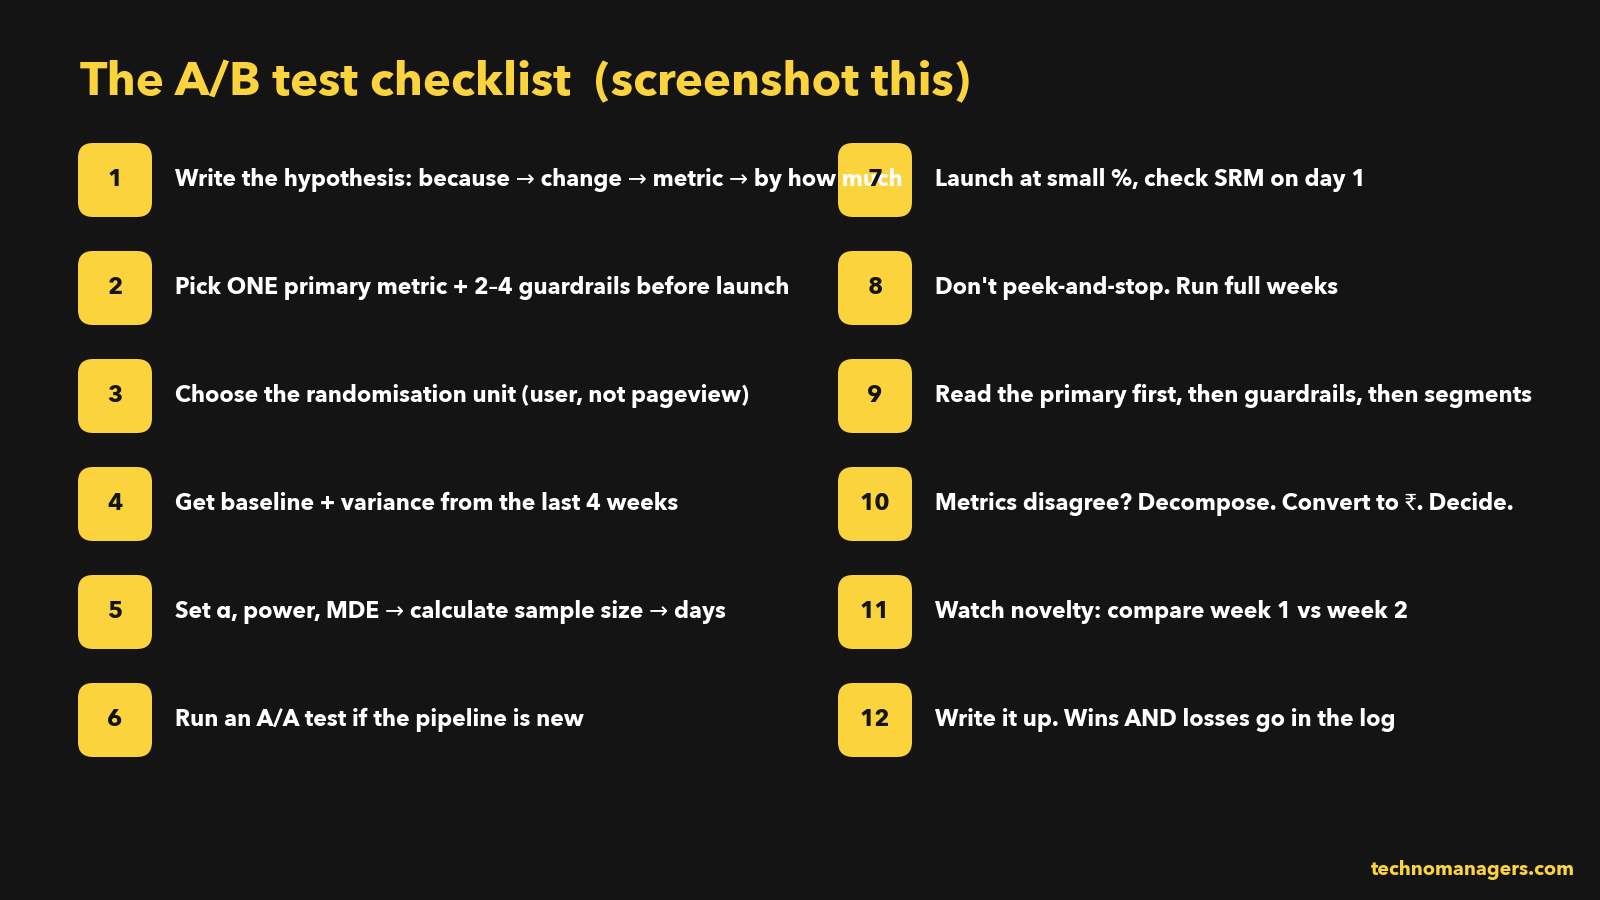
Part 6: The 12 mistakes that kill A/B tests
No hypothesis. "Let's see what happens" isn't a test, it's a wish.
Too many primary metrics. Pick one. Everything else is a guardrail or a diagnostic.
No sample size calculation. You run an underpowered test, see nothing, and conclude "it doesn't work". That's a false negative, not a learning.
Peeking and stopping early. See the A/A animation above.
Ignoring SRM. If the split is off, the results are off.
Running for less than a full week. Weekday and weekend users are different people.
Including users who can't see the change. It dilutes your effect and inflates the sample size you need.
Calling "not significant" "no effect". A wide confidence interval means "we don't know", not "zero".
Celebrating a novelty spike. Compare week 1 with week 2.
Slicing until something wins. Segment findings are new hypotheses, not results.
Optimising a metric that rises when users are frustrated. Remember the Bing bug.
Not writing it up. A failed test that's written up is worth more than a winning test nobody remembers.
Part 7: A/B testing questions in PM interviews
A/B testing comes up in almost every product sense, analytics and AI PM interview. These are the questions I see most:
"Your test increased conversion but decreased average order value. What do you do?" (Use TRADE.)
"How would you calculate the sample size for this test?" (Name the four inputs, then explain the trade-off between MDE and duration.)
"The result is significant on day 3. Do you stop?" (No. Talk about peeking, full weeks and sequential testing.)
"How would you A/B test an AI chatbot?" (The ladder: evals, shadow, canary, A/B, holdout. Plus cost and latency guardrails.)
"When would you NOT run an A/B test?" (Low traffic, one-way doors, network effects, strategic bets.)
"Your metric dropped 10% overnight. How do you investigate?" (Check SRM and logging first. Twyman's law.)
The answer that impresses interviewers isn't the formula. It's showing that you think about the decision, not just the statistics.
FAQ: A/B testing for product managers
What is A/B testing in product management?
A/B testing is a randomised experiment in which one group of users sees the current product (control) and another sees a change (variant). PMs use it to measure whether a change causes an improvement in a key metric before rolling it out to everyone.
How do you calculate sample size for an A/B test?
You need four inputs: baseline conversion rate, minimum detectable effect (MDE), significance level (usually 0.05) and statistical power (usually 80%). For a 12% baseline and a 3% relative MDE, you need about 129,600 users per variant.
What is statistical power, and why is 80% the standard?
Power is the probability that your test detects a real effect if there is one. 80% is a common balance between missing real wins (20% of the time) and needing an impractically large sample. For high-stakes decisions, teams use 90%, which needs about 34% more users.
How long should an A/B test run?
As long as it takes to reach the planned sample size, and at least one to two full weeks so you capture weekday and weekend behaviour. Decide the duration before launch.
What is a good minimum detectable effect?
The smallest lift that would change your decision and justify the cost of shipping and maintaining the feature. Mature products often target 1 to 3% relative lifts. Smaller products and bigger changes typically use 5 to 10%.
Why shouldn't you stop an A/B test early?
Because repeatedly checking the p-value and stopping when it dips below 0.05 inflates your false-positive rate, in extreme cases from 5% to about 26%. Stop early only for harm, or use a sequential testing method designed for early looks.
What are guardrail metrics?
Metrics you aren't allowed to hurt, even if the primary metric improves. Typical examples are revenue, latency, crash rate, cancellations and unsubscribes. For AI features, add cost per query, hallucination rate and safety violations.
What is sample ratio mismatch (SRM)?
SRM is when the actual split between control and variant differs significantly from the planned split, for example 50/50 planned but 52/48 observed on a large sample. It signals a bug in assignment or logging, and the results shouldn't be trusted until it's fixed.
How do you A/B test AI or LLM features?
Use offline evals on a golden dataset first, then shadow mode, then a small canary, then a properly powered A/B test with guardrails on quality, latency and cost, and finally a long-term holdout. Expect more variance and stronger novelty effects than with normal features.
What percentage of A/B tests actually win?
Fewer than you'd think. Published data shows about one-third of ideas succeed at Microsoft, around 15% at Bing, and around 8 to 10% at companies like Airbnb, Booking, Google Ads and Netflix.
Your next 24 hours
Don't close this tab and "start on Monday". Do three things today:
Rewrite one hypothesis. Take the last feature you shipped and write its hypothesis using the six-box template. Was there one?
Calculate one sample size. Pick a metric you own. Get its baseline. Work out how many users you'd need for a 3% lift and how many days that takes. You'll learn more about your product from that one number than from a week of dashboards.
Write your guardrails. For your next experiment, list the 3 metrics you aren't allowed to break, before anyone asks.
If this guide helped, share it with one PM who's about to run their first test. It'll save them a bad meeting.
Keep reading:
Sources
Kohavi, Deng & Vermeer, A/B Testing Intuition Busters (KDD 2022): success rates by company. exp-platform.com
Kohavi & Thomke, The Surprising Power of Online Experiments (HBR, 2017): Bing headline test. hbr.org
Optimizely, How Obama raised $60 million by running a simple experiment. optimizely.com
Kohavi et al., Trustworthy Online Controlled Experiments: Five Puzzling Outcomes Explained: Bing ranking bug and OEC. stanford.edu
Evan Miller, How Not To Run an A/B Test: peeking. evanmiller.org
Fabijan et al., Diagnosing Sample Ratio Mismatch in A/B Testing (Microsoft). microsoft.com
Deng, Xu, Kohavi & Walker, CUPED (WSDM 2013). exp-platform.com
Spotify Engineering, Choosing a sequential testing framework. atspotify.com
Hohnhold, O'Brien & Tang, Focusing on the Long-term (Google, KDD 2015). research.google
Duolingo, Improving Duolingo, one experiment at a time. duolingo.com
OpenAI, Expanding on what we missed with sycophancy. openai.com
OpenAI, Vijaye Raji to become CTO of Applications with acquisition of Statsig. openai.com
Microsoft ExP, How to evaluate LLMs: a complete metric framework. microsoft.com
Zheng et al., Judging LLM-as-a-Judge with MT-Bench. arxiv.org
Statsig, LLM optimization with online experimentation. statsig.com
GrowthBook, How to A/B test AI: a practical guide. growthbook.io
Airbnb Tech, interleaving experiments. airbnb.tech
Saint-Jacques et al., Using Ego-Clusters to Measure Network Effects at LinkedIn. arxiv.org
"Don't ship v1. Ship the learning" is the line I would keep. I write the decision rule down before an agent pilot starts too, so nobody rewrites it once the results come in.